
Financial Analysis and Dashboard Design (An Assessment Project)

About the Course Project
This course project is designed to provide learners with hands-on experience in financial analysis and dashboard design using real-world company financial data. Participants will work with a relational database containing key financial metrics such as sales, cost, profit, product details, and more. Through guided instructions, learners will clean how to structure data, establish relationships in Power Pivot, create interactive dashboards, and present their findings in PowerPoint slides. The ultimate goal is to develop skills that align with industry expectations for a Junior Financial Analyst role.
Learning Objectives
By completing this project, learners will:
- Understand the fundamentals of financial analysis.
- Develop skills in data cleaning and transformation using Excel.
- Establish relationships in Power Pivot for dynamic analysis.
- Design interactive dashboards to visualize key business insights.
- Create professional PowerPoint presentations to interpret financial findings.
- Gain experience working with relational databases using primary keys.
- Learn how to identify and remove outliers to improve data accuracy.
- Develop problem-solving skills to meet specified business objectives.
Requirements to Complete the Project
To successfully complete this project, learners must:
- Have a basic understanding of Excel.
- An active Internet Connection.
- Understand financial concepts such as revenue, costs, and profit margins.
Course Content (Topics Covered)
Module 1: Introduction to Financial Analysis and Dashboard Design
- Overview of financial analysis and its importance in decision-making.
- Understanding the role of dashboards in financial reporting.
- Exploring key financial metrics used in business analysis.
Module 2: Understanding the Data Structure
- Introduction to the relational database structure.
- Identifying primary keys and their role in data modeling.
- Understanding tables such as sales, returns, products, customers, and regions.
Module 3: Data Cleaning and Preparation
- Removing duplicates and handling missing values.
- Identifying and eliminating outliers.
- Structuring data for accurate financial analysis.
Module 4: Creating a Data Model in Power Pivot
- Establishing relationships between tables.
- Understanding the importance of foreign keys.
- Using Power Pivot to create a robust data model.
Module 5: Building Financial Analysis with PivotTables
- Creating PivotTables to analyze sales, costs, and profit.
- Filtering and segmenting data using slicers and timelines.
- Performing financial calculations and comparisons.
Module 6: Designing an Interactive Dashboard
- Choosing the right charts for financial storytelling.
- Using conditional formatting for insights.
- Adding slicers and interactivity for better data exploration.
Module 7: Creating PowerPoint Presentation for Data Interpretation
- Structuring a financial report presentation.
- Translating insights from dashboards into storytelling slides.
- Using visuals and data-driven narratives to present findings.
Module 8: Finalizing and Submitting the Project
- Ensuring data accuracy and dashboard completeness.
- Answering business questions using analytical findings.
- Exporting and sharing the project for assessment.
Dos and Don'ts for Executing the Course Project
Dos:
✔ Ensure data accuracy by thoroughly cleaning and validating data.
✔ Follow best practices in Power Pivot to maintain efficient data relationships.
✔ Use relevant financial metrics and business KPIs in the analysis.
✔ Keep dashboard design simple, clear, and insightful.
✔ Make PowerPoint slides concise and focused on key takeaways.
✔ Answer all specified business questions in the assessment.
✔ Cross-check calculations to ensure correctness.
✔ Use professional and readable fonts in presentations.
Don'ts:
✘ Do not modify or manipulate data to fit a preconceived narrative.
✘ Avoid overcomplicating the dashboard with excessive visuals.
✘ Do not ignore primary key relationships when modeling data.
✘ Avoid using irrelevant or redundant data in the analysis.
✘ Do not overload PowerPoint slides with excessive text.
What to Be Created
- Data Model in Power Pivot: Establishing relationships between tables.
- PivotTables & Financial Calculations: Summarizing and analyzing key data.
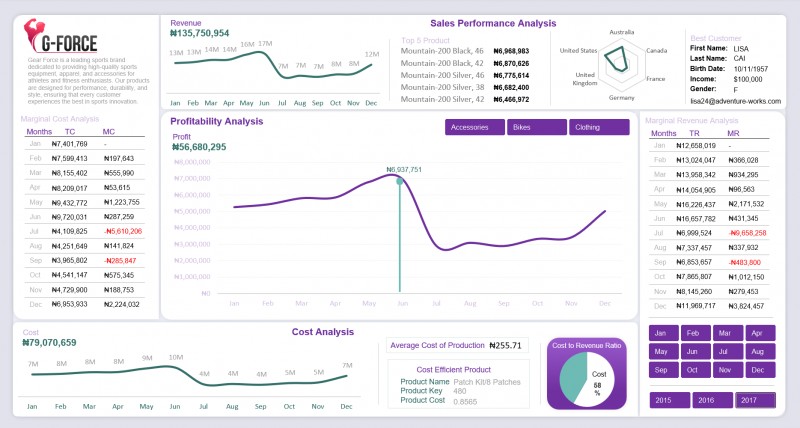
- Interactive Dashboard: Visualizing insights with charts, slicers, and KPIs.
- PowerPoint Presentation: Communicating findings with a compelling narrative.
How to Implement This Strategy in Any Other Assessment Project
The methodology used in this project can be applied to other financial assessment projects by following these key steps:
- Define the Objective: Clearly outline what business questions need to be answered.
- Prepare and Clean Data: Ensure the dataset is accurate and structured properly.
- Establish Data Relationships: Use Power Pivot to create meaningful connections.
- Conduct Financial Analysis: Apply formulas, PivotTables, and key calculations.
- Design an Interactive Dashboard: Present insights effectively with visual tools.
- Create a Presentation: Summarize findings for stakeholders in a professional format.
- Validate and Interpret Results: Ensure the analysis meets the assessment criteria.
Conclusion
This course project provides learners with real-world experience in financial analysis, dashboard creation, and business storytelling. By the end of the project, participants will have the necessary skills to perform data-driven financial assessments and confidently present their insights to decision-makers. This hands-on project will equip learners with industry-relevant competencies, preparing them for roles such as Junior Financial Analyst, Business Analyst, or Data Analyst.